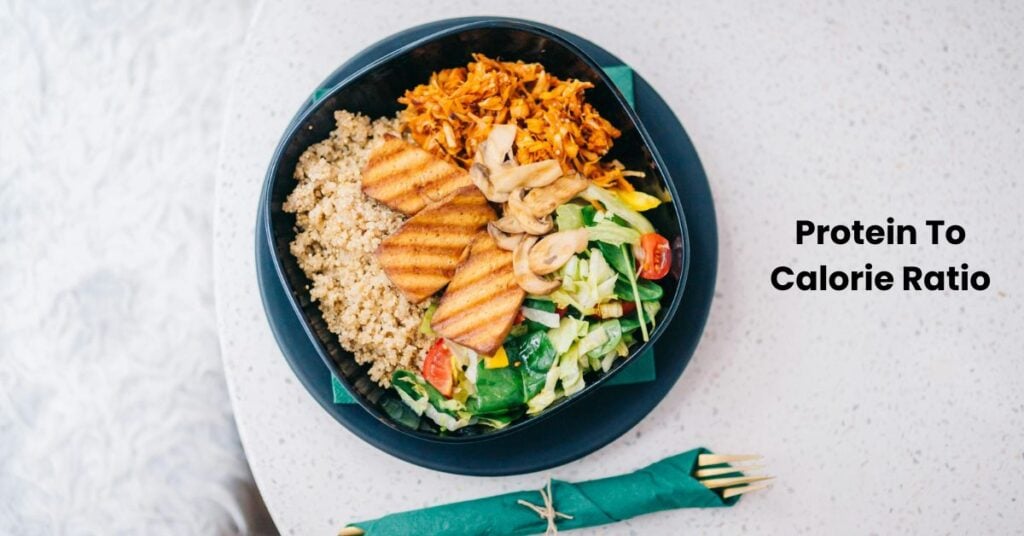
A protein-to-calorie ratio is how much protein you get for a set number of calories, so you can compare foods on the same playing field.
Protein grams are easy to spot. Calories are easy to spot. The ratio is the bridge between them. Once you’ve got it, two foods that seem similar stop being a guessing game.
If you’ve ever stood in the aisle holding two yogurts and thought, “These both say high protein… so why do they feel so different?” this is the missing step. You’ll turn a label into a simple score you can use again and again.
In this article you’ll learn how to calculate protein to calorie ratio with three clean methods. You’ll get benchmarks that make sense for real foods, plus a set of worked label examples you can copy.
| Food Type | Protein Per 100 Calories | What This Usually Signals |
|---|---|---|
| Chicken breast, lean fish | 22–28 g | Lean protein with little added fat or sugar |
| Egg whites | 20–25 g | High protein density, mild taste, low fat |
| Nonfat Greek yogurt | 16–22 g | Protein-forward dairy, check added sugar |
| Tofu, tempeh | 10–18 g | Solid protein with some fat, varies by brand |
| Beans, lentils | 7–12 g | Protein plus fiber, calories often ride with carbs |
| Protein bars | 8–18 g | Wide range; sugar alcohols and fats swing the ratio |
| Nuts, nut butters | 3–6 g | Calorie-dense fat source; protein is a bonus |
| Cheese | 5–9 g | Protein plus fat; portion size changes the story fast |
What The Ratio Tells You In One Glance
A ratio answers one plain question: “How much protein am I buying with these calories?” It’s not a moral score, and it doesn’t replace the rest of the label. It’s just a fast comparison tool.
It helps most when you’re choosing between foods in the same lane, like two cereals, two frozen meals, or two snacks. It can mislead when you compare foods with different jobs, like olive oil versus chicken. One is a cooking fat, the other is a protein food.
Pick one ratio style and stick with it while you shop. That’s how you build intuition without doing a pile of math in your head.
How To Calculate Protein To Calorie Ratio From Any Nutrition Label
Start with two numbers on the label: calories per serving and grams of protein per serving. If you can read a nutrition label, you can do this. If you want a refresher on label layout and serving sizes, the FDA’s Nutrition Facts label guide lays out what each line means.
Method 1: Grams Of Protein Per 100 Calories
This is the simplest “shopping math” method. It keeps numbers in a human range, so you can compare quickly.
- Write down protein grams and calories for one serving.
- Divide protein grams by calories.
- Multiply by 100.
You now have grams of protein per 100 calories. Higher means more protein density.
Mini Walkthrough
Label says 15 g protein and 150 calories. Divide 15 by 150 to get 0.10. Multiply by 100 to get 10. That food gives 10 g protein per 100 calories.
Method 2: Percent Of Calories From Protein
This method answers, “What share of this food’s calories comes from protein?” It’s handy when foods have mixed macros and you want a quick split.
- Multiply protein grams by 4 to convert grams to protein calories.
- Divide protein calories by total calories.
- Multiply by 100 to get a percent.
Mini Walkthrough
Label says 20 g protein and 250 calories. Protein calories are 20 × 4 = 80. Divide 80 by 250 to get 0.32. Multiply by 100 to get 32%. So 32% of the calories come from protein.
Method 3: Protein Grams Per Calorie
This is the raw version of Method 1. It’s compact and works well in a notes app or spreadsheet.
- Divide protein grams by total calories.
- Keep it as a decimal like 0.08 or 0.12.
A higher decimal means more protein per calorie. If you want a cleaner shopping number, switch back to grams per 100 calories.
Serving Size Traps That Skew The Math
Most ratio mistakes don’t come from the arithmetic. They come from the serving size line.
Check The Serving Size Before You Compare
Two bags of chips can show different serving sizes. One brand may call a serving 28 g, the other 50 g. If you compare the protein and calories without noticing that, you’re comparing apples and oranges.
Fix: run the ratio on each label as-is, then compare the ratio results, not the raw grams.
Watch Multi-Serve Packages
Some ready-to-drink shakes list nutrition per bottle. Others list per half bottle. That alone can swing your impression.
Fix: if you eat the full package, use the full package numbers. If you split it, use the listed serving numbers.
Fiber And Sugar Alcohols Can Blur Calories
Protein bars and “keto” snacks can include sugar alcohols and fibers that brands calculate in different ways. Your ratio still works as a comparison inside that category, but be cautious comparing those items to plain foods like yogurt or meat.
Benchmarks That Feel Real In Daily Eating
There’s no single “right” ratio for all meals. Still, it helps to know what the numbers usually mean.
- 15 g+ protein per 100 calories: typical of lean protein foods and some nonfat dairy.
- 10–14 g per 100 calories: common for mixed foods that still lean protein-forward.
- 6–9 g per 100 calories: normal for many whole foods like beans and some cheeses.
- Under 6 g per 100 calories: usually a fat- or carb-heavy choice where protein is not the main draw.
Use these bands as a quick filter, not a rulebook. A lower ratio can still be a smart pick when it brings other things you want, like healthy fats, fiber, or a taste you’ll stick with.
Getting Numbers When There’s No Label
Restaurants, bulk bins, and fresh foods often lack a full package label. You can still run the same math if you can get calories and protein grams from a reliable database.
The easiest source is USDA FoodData Central. Search the food, choose the closest match, and note calories and protein for the portion you plan to eat. Then plug those values into Method 1 or Method 2.
One tip: match the form. Cooked rice and dry rice are not the same. Raw chicken and cooked chicken differ. Pick the entry that matches what’s on your plate.
Worked Label Math You Can Copy
Below are common label patterns and what the ratios look like. Use the method you prefer, then keep that method consistent when you compare similar foods.
| Label Numbers | Math | Result |
|---|---|---|
| Protein 18 g, Calories 180 | (18 ÷ 180) × 100 | 10 g per 100 calories |
| Protein 25 g, Calories 160 | (25 ÷ 160) × 100 | 15.6 g per 100 calories |
| Protein 12 g, Calories 300 | (12 ÷ 300) × 100 | 4 g per 100 calories |
| Protein 20 g, Calories 250 | (20 × 4) ÷ 250 × 100 | 32% of calories from protein |
| Protein 8 g, Calories 120 | (8 ÷ 120) × 100 | 6.7 g per 100 calories |
| Protein 30 g, Calories 400 | (30 ÷ 400) × 100 | 7.5 g per 100 calories |
| Protein 10 g, Calories 90 | (10 ÷ 90) × 100 | 11.1 g per 100 calories |
Using The Ratio Without Turning Meals Into Homework
The ratio shines when you use it as a nudge, not a judge. Here are practical ways to apply it without getting stuck in the weeds.
Use It For Side-By-Side Choices
Comparing two items in the same category is where it’s cleanest. Two wraps. Two granolas. Two frozen bowls. Pick the one with the higher protein density if your goal is more protein without extra calories.
Pair Low-Ratio Foods With A Protein Anchor
Some foods are low ratio and still earn a spot. Oats, rice, fruit, nuts, olive oil. If you want protein in that meal, add an anchor: eggs, Greek yogurt, fish, chicken, tofu, or beans. The plate still tastes good, and the overall meal ratio rises.
Use A Simple Target For Snacks
Snacks are where calories can creep up fast. A quick target keeps things steady: aim for 8–12 g protein per 100 calories when you can, and don’t stress when a snack is meant to be a treat.
Spot “Protein-Washed” Foods
Some products add a small amount of protein and market it hard. The ratio reveals that fast. If the number sits under 6 g per 100 calories, it’s not a protein-forward item, even if the front label says so.
A Fast Checklist You Can Save
- Read calories per serving and protein grams per serving.
- Compute (protein ÷ calories) × 100 for grams per 100 calories.
- Keep serving size in mind before comparing two foods.
- Use the ratio to compare like-with-like categories.
- Pick a protein anchor when the rest of the meal is low ratio.
After a few rounds, the math turns into pattern recognition. At that point, how to calculate protein to calorie ratio becomes something you can do in your head while you scan a label.
References & Sources
- U.S. Food and Drug Administration (FDA).“How to Understand and Use the Nutrition Facts Label.”Explains label parts, serving size, and how to read calories and nutrients.
- USDA.“FoodData Central.”Provides calorie and protein values for many foods when a package label isn’t available.

Mo Maruf
I created WellFizz to bridge the gap between vague wellness advice and actionable solutions. My mission is simple: to decode the research and give you practical tools you can actually use.
Beyond the data, I am a passionate traveler. I believe that stepping away from the screen to explore new environments is essential for mental clarity and physical vitality.